
Interactive data feature
America’s Power Landscape
Every planned generator in America, what changed last month, and what the change looks like from orbit. The map is the where, the index is the how fast, and the satellite frames are the proof.
Where the buildout is
EVERY PLANNED GENERATOR, EIA-860M · CLICK ANY DOT FOR ITS STORY · RINGED DOTS HAVE SATELLITE IMAGERY · DRAG TO PAN, BUTTONS OR SCROLL TO ZOOM
Bubble area represents generation nameplate MW or battery discharge MW. Storage is not generation. Operating units are excluded.
Click a dot to see that plant's story — when it entered the pipeline, whether it broke ground, how far its date has moved, and (for ringed dots) how it looks from orbit.
From orbit
THE LATEST GROUNDBREAKINGS WITH IMAGERY · NASA HLS · IDENTICAL ~6.7 KM FRAMES
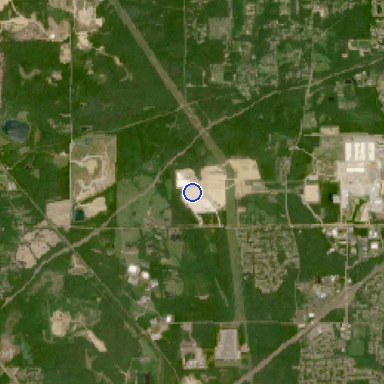
broke ground 2026-06 · now aiming for 2028-08
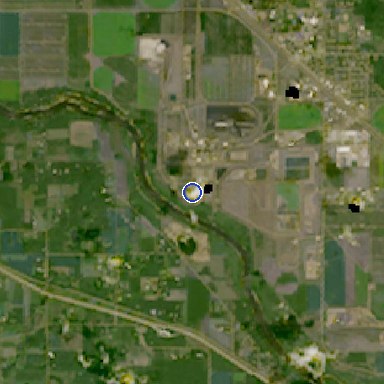
broke ground 2026-06 · now aiming for 2027-12
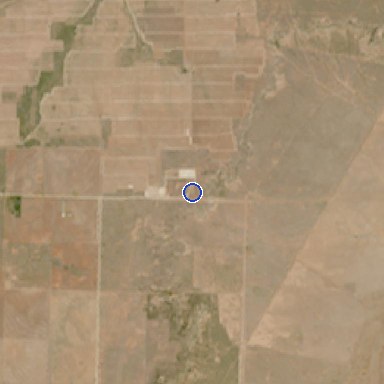
broke ground 2026-06 · now aiming for 2026-11
Groundbreaking
MW ENTERING CONSTRUCTION PER MONTH, BY TECHNOLOGY · METHOD & MEANING →
The Power Delay Index
SHARE OF PLANNED CAPACITY RUNNING BEHIND ITS ORIGINAL SCHEDULE · METHOD & MEANING →
Every developer files a promised completion date with EIA. The index is simple: what share of planned capacity now promises a later date than the first one its developer ever filed. As of 2026-06: 43%. How late? On average, the megawatts in the pipeline run 8.53 months behind their original schedules — a total backlog of 2,437 GW-months. The index falls when dates move back up or when delayed projects finish or cancel and leave the pipeline.
Promise changes, month by month
GW OF PROJECTS WHOSE PROMISED DATE MOVED VS. THE PRIOR MONTH — LATER (RED, ABOVE ZERO) OR EARLIER (GREEN, BELOW) · METHOD & MEANING →
Each bar compares this month's promises with last month's, project by project. Green means a date moved closer than previously promised — usually clawing back part of an earlier delay, occasionally moving ahead of the original schedule. The imbalance is the story: in a typical month, ten to thirty times more capacity gets pushed later than gets pulled earlier.
Power delays: AI vs. everyone else
SHARE OF PLANNED CAPACITY BEHIND SCHEDULE — THE 34 DATA-CENTER COUNTIES VS. EVERYWHERE ELSE · METHOD & MEANING →
There is no national inventory of data centers, but the power built to feed them files with EIA like everything else. Cut the Power Delay Index to the 34 counties where America's data centers cluster — Loudoun, Maricopa, New Albany's Licking County, Abilene's Taylor County — and a story appears: across 2025, power in data-center counties ran far less late than everyone else's (~26% vs ~39% behind schedule) — a genuine priority lane. In early 2026 the lines converged (39% vs 43%): the queue caught up with AI.
Where the pipeline is growing
PLANNED CAPACITY, INDEXED TO 2023-07 = 100 — SAME SPLIT · METHOD & MEANING →
The other half of the AI story is volume. Planned capacity in the data-center counties grew 118% since 2023-07 (10 → 21 GW), against 72% everywhere else (154 → 265 GW). 1,075 MW broke ground in those counties in 2026-06.
Red states, blue states
THE BUILDOUT BY 2024 PRESIDENTIAL VOTE (STATEWIDE WINNER) · 31 RED STATES VS. 20 BLUE INCL. DC
The energy transition is being built in Trump country. Red states hold 217 GW of the planned pipeline against 69 GW in blue states, took 75% of all groundbreaking megawatts over the last twelve months — and the red pipeline is 68% solar, battery, and wind (blue: 89%). Stage-wise the two queues look surprisingly alike — 32% of the red pipeline and 35% of blue's is already under construction — so the real difference is scale: red states are physically building 70 GW right now to blue's 24 GW. And blue-state power runs later: 49% of blue-state capacity is behind its original schedule vs 41% of red, a gap that has widened through 2026 and survives excluding wind entirely (47% vs 39%). States are colored by the 2024 statewide presidential winner.
Construction by state
PLANNED CAPACITY BY STATE AND TECHNOLOGY · TOP 14 STATES · METHOD & MEANING →
What moved in 2026-06
THE LARGEST EVENTS IN THE LATEST EIA-860M VINTAGE
BROKE GROUND
- Traceview Advanced Power Station · MS · 819 MW
- Swenson Solar · TX · 600 MW
- Sherco BESS · MN · 600 MW
- Panther Grove Wind, LLC · IL · 423 MW
- Blacks Creek Solar · ID · 400 MW
LARGEST DELAYS
- Danish Fields Solar, LLC · TX · +1 mo · 600 MW
- GREC · OK · +3 mo · 594 MW
- Renegade Solar Project (Dawn) · TX · +12 mo · 515 MW
- Grace Energy Center · CA · +4 mo · 500 MW
- Grace Energy Center · CA · +2 mo · 500 MW
COMPLETED
- Dusty Rose Wind · CO · 502 MW
- Green River Energy Center - Hybrid · UT · 400 MW
- Green River Energy Center - Hybrid · UT · 400 MW
- Easley Solar · CA · 350 MW
- Nighthawk Energy Storage, LLC · CA · 300 MW
About this page
The map shows every non-operating generating and storage unit in the latest EIA-860M inventory, refreshed daily. Consecutive monthly EIA-860M vintages are diffed by plant and generator ID. Groundbreaking is MW whose reported status first enters the construction bucket (under construction or construction complete); each generator can break ground once. Completions are planned generators newly appearing on the Operating sheet. New pipeline is first-ever appearance on the Planned sheet. Canceled is movement from Planned to the Canceled or Postponed sheet. The Slippage Index is the MW-weighted change in planned in-service dates, in months, across generators planned in both vintages; positive values mean the pipeline moved further away.
Plant dossiers: One biography per plant still in the latest EIA-860M Planned sheet, rolled up from the vintage diffs: first vintage seen, groundbreaking vintage (first entry into the construction bucket), MW-weighted months of drift between each generator's first reported planned date and its current one, and the plant's latest planned in-service month. Values equal to the baseline vintage mean 'then or earlier'.
The AI split cuts the same series to 34 hand-curated counties where America's data centers cluster; power planned there feeds the grid, not one campus, so the split is a proxy, not a data-center inventory. The red/blue split partitions states by the statewide winner of the 2024 presidential election — political fact, not an estimate — with ME and NE by statewide vote. Each chart's page carries its full method and limits.
Satellite imagery: NASA Worldview Snapshots (GIBS), HLS S30/L30 true color, 30m; sites from EIA-860M — courtesy NASA, free to reuse with attribution. Battery MW is discharge power, not generation. Projects can change size, date, status, or disappear in later releases.
Sources: EIA-860M ↗ · NASA Worldview Snapshots ↗ · imagery courtesy NASA GIBS/Worldview, free to reuse with attribution